
One Year After Liberation Day: How Tariffs Rewired European ETF Flows
The anniversary of Trump's tariff shock marks a turning point that European ETF investors are still riding — and the data suggests the rotation is far from over.


At a Glance
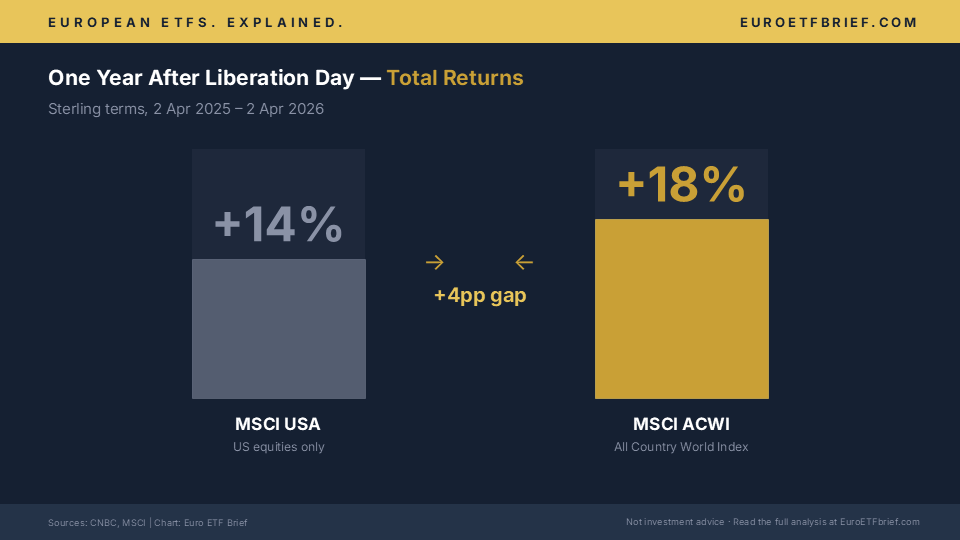
One year after “Liberation Day,” the MSCI All Country World Index has returned 18% in sterling terms — outpacing the MSCI USA’s 14%. The US exceptionalism trade has cracked.
European-domiciled ETF assets have surged from $3.22 trillion to $3.53 trillion in 2026 alone, with record inflows of $470 billion forecast for the full year.
International ETFs are substantially outperforming US-focused index funds in 2026, driven by a weaker dollar, attractive valuations outside US mega-caps, and a structural increase in European defence and infrastructure spending.
Vanguard projects international stocks will outperform US equities over the next decade (7% vs. 4–5% annualised) — a rare directional call from the index giant.
A proposed EU–US trade deal at 15% tariffs (down from 30%) could stabilise conditions, but new tariffs on pharmaceuticals and metals keep the outlook uncertain.
April 2, 2025: The Day the Trade Map Changed
A year ago this week, Donald Trump signed the “Liberation Day” tariff proclamation — a sweeping package that slapped 20% duties on EU exports to the United States. Markets sold off globally. The DAX dropped. European industrials and automakers, from Volkswagen to BMW to Siemens, found themselves on the front line of a trade war they hadn’t started. For a brief, panicked moment, the consensus was clear: this would hurt Europe more than anyone.
That consensus turned out to be wrong — or at least incomplete. Twelve months on, the story that has actually unfolded is one of the largest capital rotations in recent memory: out of US assets, into the rest of the world, and into Europe in particular.
The numbers are striking. Since Liberation Day, the MSCI USA index has returned 14% in sterling terms. That sounds respectable — until you compare it to the MSCI All Country World Index, which returned 18% over the same period. For the first time in years, holding “the rest of the world” beat holding America.
The Great Rotation — in Numbers
If Liberation Day was the catalyst, the flow data tells you the rotation was already building. Investors had been quietly questioning US mega-cap concentration for months. The tariff shock turned a whisper into a shout.
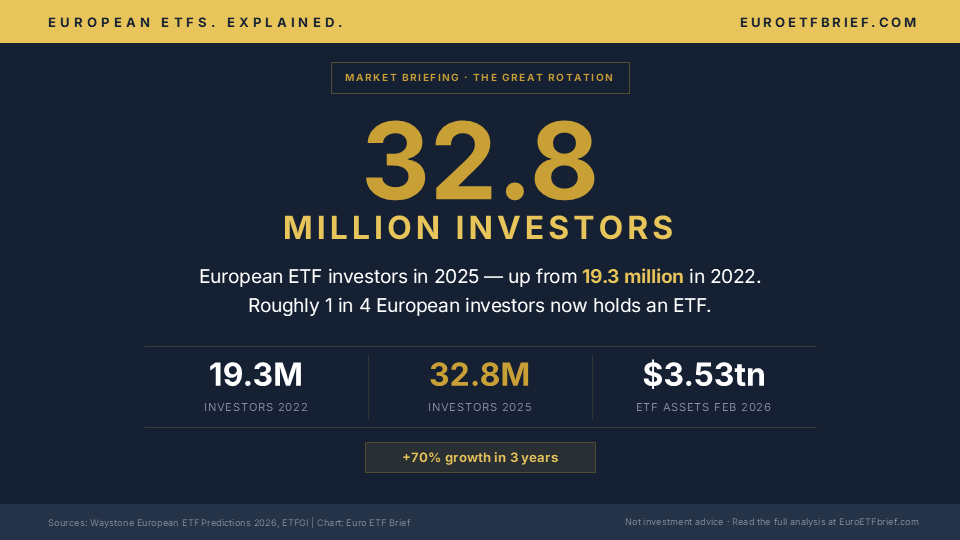
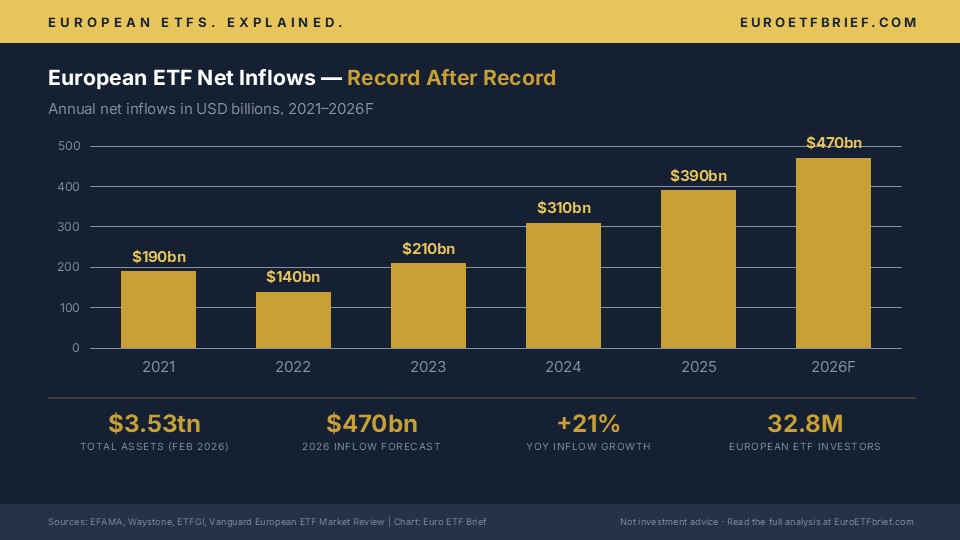
European-domiciled ETF and ETP assets climbed 9.4% year-to-date through February 2026, rising from $3.22 trillion to $3.53 trillion. Equity ETFs alone pulled in $44.4 billion in February and $85.8 billion in the first two months of the year — nearly double the $48.5 billion recorded over the same period in 2025. For the full year, analysts expect European ETF inflows to hit a record $470 billion, up from $390 billion in 2025 and smashing the previous record of EUR 269 billion set in 2024.
The investor base is growing just as fast. Europe now counts 32.8 million ETF investors, up from 19.3 million in 2022. Roughly one in four European investors holds an ETF — a milestone that would have seemed optimistic just three years ago.
And it’s not just European money staying home. Bank of America declared a “New World Order” for international stocks earlier this year, noting that inflows to international ETFs had soared past $250 billion by mid-February. The message from institutional allocators was unambiguous: reduce US overweight, add international exposure.
Why the Rotation Is More Than a Knee-Jerk Reaction
A tariff-induced sell-off could have been a one-quarter story — buy the dip in US tech, move on. That hasn’t happened. Several structural forces have converged to make the US-to-international rotation stickier than most expected.
Valuations. US mega-cap tech stocks entered 2025 at historically elevated multiples. After a decade of outperformance, the gap between US and international valuations had widened to levels not seen since the late 1990s. For valuation-conscious investors — and European retail investors tend to be exactly that — the risk-reward arithmetic shifted.
The dollar. A weaker US dollar in 2026 has amplified returns for non-US assets when measured in local currency terms. For European investors holding UCITS ETFs denominated in euros, the currency tailwind has turned international diversification from a theoretical argument into a practical one.
Defence and infrastructure spending. Europe’s strategic response to the geopolitical environment has been to spend. NATO members committed to 5% of GDP on defence and security by 2035, with 1.5% earmarked for infrastructure and resilience. Defence ETFs alone have absorbed $1.3 billion in net flows in 2026 (WisdomTree’s franchise alone), while new products targeting European infrastructure, strategic autonomy, and reshoring have launched at a pace not seen before.
Vanguard’s decade call. Perhaps the most telling signal came from Vanguard, the world’s second-largest asset manager. In a rare directional projection, Vanguard forecast that international stocks would outperform US equities over the next ten years — 7% annualised versus 4–5% for the US. When the index giant known for “buy everything and hold it” starts highlighting non-US opportunities, the market listens.
The Tariff Landscape Today: Still Evolving
If you’d hoped the tariff story would simplify over time, April 2026 has disappointed. Trump’s latest moves include tariffs of up to 100% on branded pharmaceuticals and modified Section 232 duties on steel, aluminium, and copper, effective 6 April. German automakers and industrials remain directly exposed.
But there’s a counterweight. On 26 March, the EU legislative body approved a proposed US–EU reciprocal trade agreement that would set tariffs on most EU goods at 15% — halved from the original 30% — in exchange for European investment commitments in the US. If finalised, this deal could stabilise the trade backdrop and give European export-heavy sectors breathing room.
The DAX has felt the tension: down roughly 7.6% in April as markets digest the push and pull between escalation and negotiation. But the broader picture remains one of capital flowing toward European assets, not away from them.
What This Means for Your Portfolio
The rotation has concrete implications for European ETF investors — and the product landscape is adapting.
Broad international exposure. International ETFs are outperforming US-focused funds in 2026, and the product shelves reflect it. Lloyd Capital’s OTUS ETF, launched via HANetf in April, deliberately excludes US companies entirely — a concentrated bet on Europe, China, and Canada. It’s a sign that issuers see lasting demand for ex-US strategies, not just a tactical blip.
European equity and thematic funds. The “Sell America, Buy Europe” rotation is a structural tailwind for European-focused ETF products — from broad MSCI Europe trackers to thematic plays on defence, infrastructure, and strategic autonomy. HANetf’s GR8 ETF, which equally weights European defence, energy, infrastructure, and reshoring, captures the thesis in a single product. WisdomTree has expanded its defence franchise to three funds spanning Europe, Asia, and global markets.
Fee competition benefits you. The capital pouring into European ETFs is intensifying price competition. Invesco cut its MSCI World UCITS ETF fee from 0.19% to just 0.05% on 1 April — making it the cheapest MSCI World tracker in Europe. When $470 billion in annual inflows is at stake, issuers compete on price, and investors benefit.
Core allocation shift. For investors who built their portfolio around a heavy US tilt — and many European savings plan investors did exactly that over the past decade — the question is whether to rebalance. This isn’t a call to sell everything American. But the data, the flows, and the structural forces all point in the same direction: the automatic assumption that US equities will lead has, at least for now, been disrupted.
Is This Structural — or Will the US Bounce Back?
That’s the question worth sitting with. The bulls on US exceptionalism will point to AI-driven productivity gains, corporate earnings resilience, and the sheer depth of US capital markets. They’re not wrong — the US remains the world’s largest economy and its most innovative tech ecosystem.
But the bears — or perhaps more accurately, the realists — will note that valuations matter over the long term, that currency cycles are real, and that Europe’s policy response (defence spending, infrastructure investment, the Altersvorsorgedepot retirement reform) is creating genuine catalysts that didn’t exist two years ago.
What we can say with certainty is this: the one-year anniversary of Liberation Day marks a turning point. European ETF assets have hit $3.53 trillion. The investor base has grown by 70% in four years. Record inflows continue. And for the first time in a long time, the default portfolio assumption — overweight the US, underweight everything else — is being seriously challenged.
The rotation may not last forever. But the forces driving it look more structural than seasonal. For European ETF investors, that’s a story worth watching — and one your portfolio should probably reflect.
Further Reading
Liberation Day — one year on: investors are rethinking US assets — CNBC retrospective on the capital rotation triggered by the April 2025 tariffs
Trump’s tariffs could end up being an opportunity for the European ETF industry — Funds Society analysis of how European issuers benefit from the rotation
Vanguard projects international stocks will beat the US for 10 years — 24/7 Wall St. on Vanguard’s rare directional forecast
International ETFs are crushing VOO in 2026 — 24/7 Wall St. performance comparison of international vs. US equity ETFs
European ETF/ETP assets rise to $3.53 trillion — ETFGI market report, February 2026
Trump tariffs and the trade war — Tax Foundation tracker on the proposed EU–US reciprocal trade agreement at 15%
European ETF predictions 2026 — Waystone forecast on record inflows and 200+ new active ETFs
Like this kind of analysis? Euro ETF Brief covers European thematic ETFs every week — Spotlights, Company Deep Dives, and Market Briefings like this one.
Disclaimer: This article does not constitute investment advice, a recommendation, or a solicitation to buy or sell any securities. The information contained herein is for educational and informational purposes only and does not replace individual advice from a qualified financial advisor. All investments carry risk, and the value of investments can fluctuate. Your capital is at risk, and past performance is not a reliable indicator of future results. While we strive to ensure the accuracy of the information provided, we make no representations or warranties regarding its completeness or accuracy. Disclosure: The author holds positions in the ETFs or securities mentioned.